
Ideas for a better investment
Mortgage Note Investing Statistics: The Data Behind the Market (2026)
Mortgage note investing statistics for 2026: market size, average note pricing, default and foreclosure data, and the retirement account angle — all sourced from primary industry reports.

9 min read

Key Takeaways
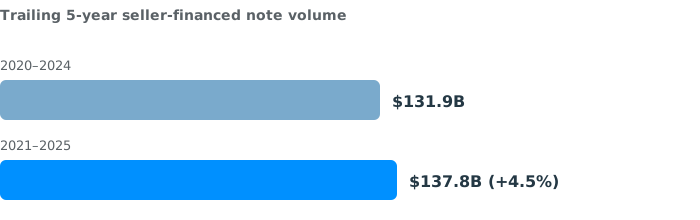
- The seller-financed note market produced $137.8 billion in notes over the trailing five years (2021–2025), up 4.5% from the prior five-year span — a market that’s growing, not shrinking.
- In 2025, 87,212 transactions were owner-financed nationally, with 62% of them residential and 66% concentrated in just 10 states.
- The average residential note carried a 76% LTV and a balance of roughly $272,856 in 2025 — both a useful benchmark when pricing a deal.
- The national non-performing loan ratio sat at ~1.5% as of September 2025, while the average foreclosure timeline was 563 days in Q2 2026.
- HOA liens hit 284,933 filings in 2025, up 8.6% year-over-year — a real, growing risk factor for note buyers to check for.
- Self-directed IRAs hold only an estimated 2–5% of the $18.9–19.2 trillion U.S. IRA market, but real estate remains the single most common alternative allocation among SDIRA holders.
Mortgage note investing runs on numbers — yield, LTV, default rates, timelines — but a lot of the data that actually shapes those numbers lives scattered across industry reports most investors never see. This guide pulls the most useful, current statistics on the mortgage note and seller-financing market into one place: how big the market actually is, what a typical note looks like, how often things go wrong, and how retirement accounts fit into the picture. Every figure here is sourced and linked at the bottom.
Quick answer
The seller-financed note market produced $137.8 billion in notes over the five years from 2021–2025, across roughly 87,000 transactions in 2025 alone. The average residential note carries about a 76% LTV and a $272,856 balance. Nationally, about 1.5% of loans are non-performing, the average foreclosure takes 563 days, and HOA liens — a real risk for note buyers — hit nearly 285,000 filings in 2025. Self-directed IRAs, a common vehicle for note investing, hold a small slice (2–5%) of the $19 trillion U.S. IRA market, with real estate as the leading alternative allocation.
How Big Is the Note Market?
Seller financing — where the property owner acts as the lender instead of a bank — isn’t a niche corner of real estate. It’s a market with real, measurable scale, and it’s grown over the past five years even as the broader housing market cooled.
Source: Note Investor, Seller Financing 2025 Industry Report.
That growth happened against a backdrop of a slowing traditional housing market — existing home sales hit 30-year lows in the same period, according to the National Association of REALTORS®. When bank financing gets harder to access, seller financing tends to pick up some of the slack.
New to this? Start with what is a contract for deed and what is a promissory note for the documents behind these numbers.
Note Pricing Benchmarks
Average note size and loan-to-value differ meaningfully by property type — useful context when you’re trying to judge whether a specific deal is priced in line with the broader market.
| Property type | Average balance | Average LTV |
|---|---|---|
| Residential | $272,856 | 76% |
| Commercial | $661,996 | 72% |
| Land | $286,178 | 73% |
LTV ticked up slightly across all three categories in 2025 compared to prior years — a sign that sellers are carrying a somewhat larger share of the financing on each deal. That’s a trend worth factoring into how you price and evaluate a note today, not just what LTV looked like a few years ago.
Where Notes Get Created
Seller-financed notes are heavily concentrated by geography and by seller behavior. Roughly 66% of 2025 transactions happened in just 10 states, with Texas, Florida, California, North Carolina, and Georgia leading. And most sellers aren’t running a note-creation business: about 86% of sellers created only a single note in a 12-month period, meaning the bulk of this market is individual property owners financing a single sale, not institutional players churning out volume.
Buying from an individual seller? Our mortgage note buying & selling etiquette guide covers how to work with first-time note sellers professionally, since most of them have only done this once.
Default, Delinquency & Foreclosure Data
Not every note performs as expected, and the data on defaults and foreclosure timelines is worth knowing before you assume a worst-case outcome will be quick or predictable.
The U.S. non-performing loans ratio as of September 2025 — a useful national baseline, though any individual note’s risk depends heavily on its specific borrower, collateral, and lien position. (CEIC Data)
The average U.S. foreclosure timeline in Q2 2026 — the shortest since 2013 — even as foreclosure filings rose 21% year-over-year in the first half of 2026. (ATTOM Data Solutions)
Both figures are national averages, and both hide enormous variation by state and by the specific circumstances of a loan. See our mortgage note exit strategies guide for how that timeline breaks down by state and what the realistic options look like once a note actually goes non-performing.
Avoid the problem in the first place: Our due diligence guide and due diligence checklist walk through what to verify before you buy, and our note investing red flags guide covers the specific warning signs that predict a note like this one.
The Senior-Lien Risk, By the Numbers
One category of risk that’s easy to underestimate: liens that can jump ahead of a note’s position, sometimes without the buyer ever seeing it coming.
HOA liens filed nationwide in 2025 — up 8.6% from 2024, roughly one every 90 seconds. Florida alone accounted for 17.4% of the national total. (Benutech, via HousingWire)
Separately, more than 82,000 FHA-backed loans originated in 2023 carried at least one small subordinate lien, totaling roughly $880 million in additional obligations that wouldn’t show up in standard LTV or payment-history screening. And in a 2025 NAR survey, 63% of real estate professionals reported being aware of title fraud occurring in their market within the past year — a related, if distinct, category of hidden property-title risk.
Go deeper: Our senior-lien checks guide walks through the exact record checks that catch this kind of risk before you bid.
The Retirement Account Angle
A meaningful share of note investing capital comes through self-directed retirement accounts, which let investors hold notes and real estate inside a tax-advantaged IRA rather than being limited to stocks, bonds, and mutual funds.
| Metric | Figure |
|---|---|
| Total U.S. IRA market | $18.9–19.2 trillion (ICI, Q3/Q4 2025) |
| Share held in self-directed IRAs | An estimated 2–5% |
| Leading alternative allocation | Real estate, cited by roughly 58–71% of SDIRA holders depending on survey |
| 2026 IRA contribution limit | $7,500 ($8,600 with catch-up, age 50+) |
That 2–5% figure is a small slice of a very large pie — the total U.S. IRA market is nearly $19 trillion — which suggests real room for growth in self-directed and note-focused retirement investing as more account holders become aware it’s an option.
Learn more: See mortgage note investing for beginners for how SDIRA note purchases fit into a first-time investor’s overall approach.
Key Terms to Know
Loan-to-value (LTV)
The loan balance as a percentage of the property’s value — a core measure of how much equity cushion exists in a note.
Non-performing loan (NPL)
A loan on which the borrower has stopped making scheduled payments, requiring active workout or resolution rather than passive collection.
Seller financing
An arrangement where the property seller acts as the lender, and the buyer makes payments directly to them instead of a bank.
Self-directed IRA (SDIRA)
A retirement account that allows the holder to invest in alternative assets — including real estate and private notes — beyond publicly traded securities.
Foreclosure timeline
The total time from the start of the foreclosure process to its completion, which varies enormously by state and by whether the process is judicial or non-judicial.
Super-lien
A lien — often for taxes or HOA dues — that state law allows to jump ahead of a first mortgage’s priority, regardless of when it was recorded.
Frequently Asked Questions
How big is the mortgage note investing market?
The seller-financed note segment alone produced $137.8 billion in notes over the trailing five years (2021–2025), up 4.5% from the prior five-year period, according to Note Investor’s 2025 Industry Report. In 2025, that included roughly 87,212 individual owner-financed transactions.
What is the average size of a seller-financed note?
In 2025, residential notes averaged about $272,856 at a 76% LTV, commercial notes averaged about $661,996 at a 72% LTV, and land notes averaged about $286,178 at a 73% LTV, according to Note Investor’s industry data.
What percentage of loans are non-performing in the U.S.?
The national non-performing loans ratio stood at approximately 1.5% as of September 2025, according to CEIC Data. That’s a broad national baseline; any individual note’s actual risk depends on its specific borrower, collateral, and lien position.
How long does foreclosure take on average?
The national average was 563 days in Q2 2026, according to ATTOM Data Solutions — the shortest average since 2013, even as foreclosure filings rose 21% year-over-year in the first half of 2026. Actual timelines vary enormously by state.
How common are HOA liens?
HOAs filed 284,933 liens nationwide in 2025 — up 8.6% from 2024, or roughly one every 90 seconds, according to Benutech data reported by HousingWire. Florida accounted for 17.4% of the national total.
What share of retirement accounts are self-directed?
An estimated 2–5% of the roughly $18.9–19.2 trillion total U.S. IRA market (per the Investment Company Institute) sits in self-directed accounts. Real estate remains the most commonly cited alternative allocation among self-directed IRA holders, though the exact share varies by survey.
Which states have the most seller-financed notes?
Texas, Florida, California, North Carolina, and Georgia were the top five states in 2025, and about 66% of all seller-financed transactions that year were concentrated in just 10 states, according to Note Investor’s industry data.
Are most seller-financed notes created by individuals or companies?
Overwhelmingly individuals. About 86% of sellers created only a single note in a 12-month period in 2025, meaning most of this market is individual property owners financing a single sale rather than institutional or high-volume note originators.
Turn Data Into Deals
Paperstac Academy teaches how to apply market data like this to real note evaluation — pricing, risk, and due diligence — with real case studies and document tools, guided by CEO Rick Allen and hundreds of closed transactions.
Explore Paperstac AcademyKeep Learning
Related resources from the Paperstac blog.
Sources & References
- Note Investor. Seller Financing 2025 Industry Report. noteinvestor.com
- CEIC Data. US Non-Performing Loans Ratio. ceicdata.com
- ATTOM Data Solutions, via HousingWire. Foreclosures climb 21% in first half of 2026 as timelines shorten. housingwire.com
- HousingWire / Benutech. HOA liens climb 8.6% in 2025 as Sun Belt pressure mounts. housingwire.com
- HousingWire / Benutech. Hidden liens on 2023 FHA loans. housingwire.com
- National Association of REALTORS®. 2025 Deed & Title Fraud Survey. nar.realtor
- Investment Company Institute (ICI). Quarterly retirement market data, Q3/Q4 2025. ici.org
This article is for educational purposes only and does not constitute legal, tax, or investment advice. Statistics reflect the most recent data available from each cited source at time of publication and are subject to change. Always verify current figures and consult qualified professionals before making investment decisions. © 2026 Paperstac.